Utilization
Overview
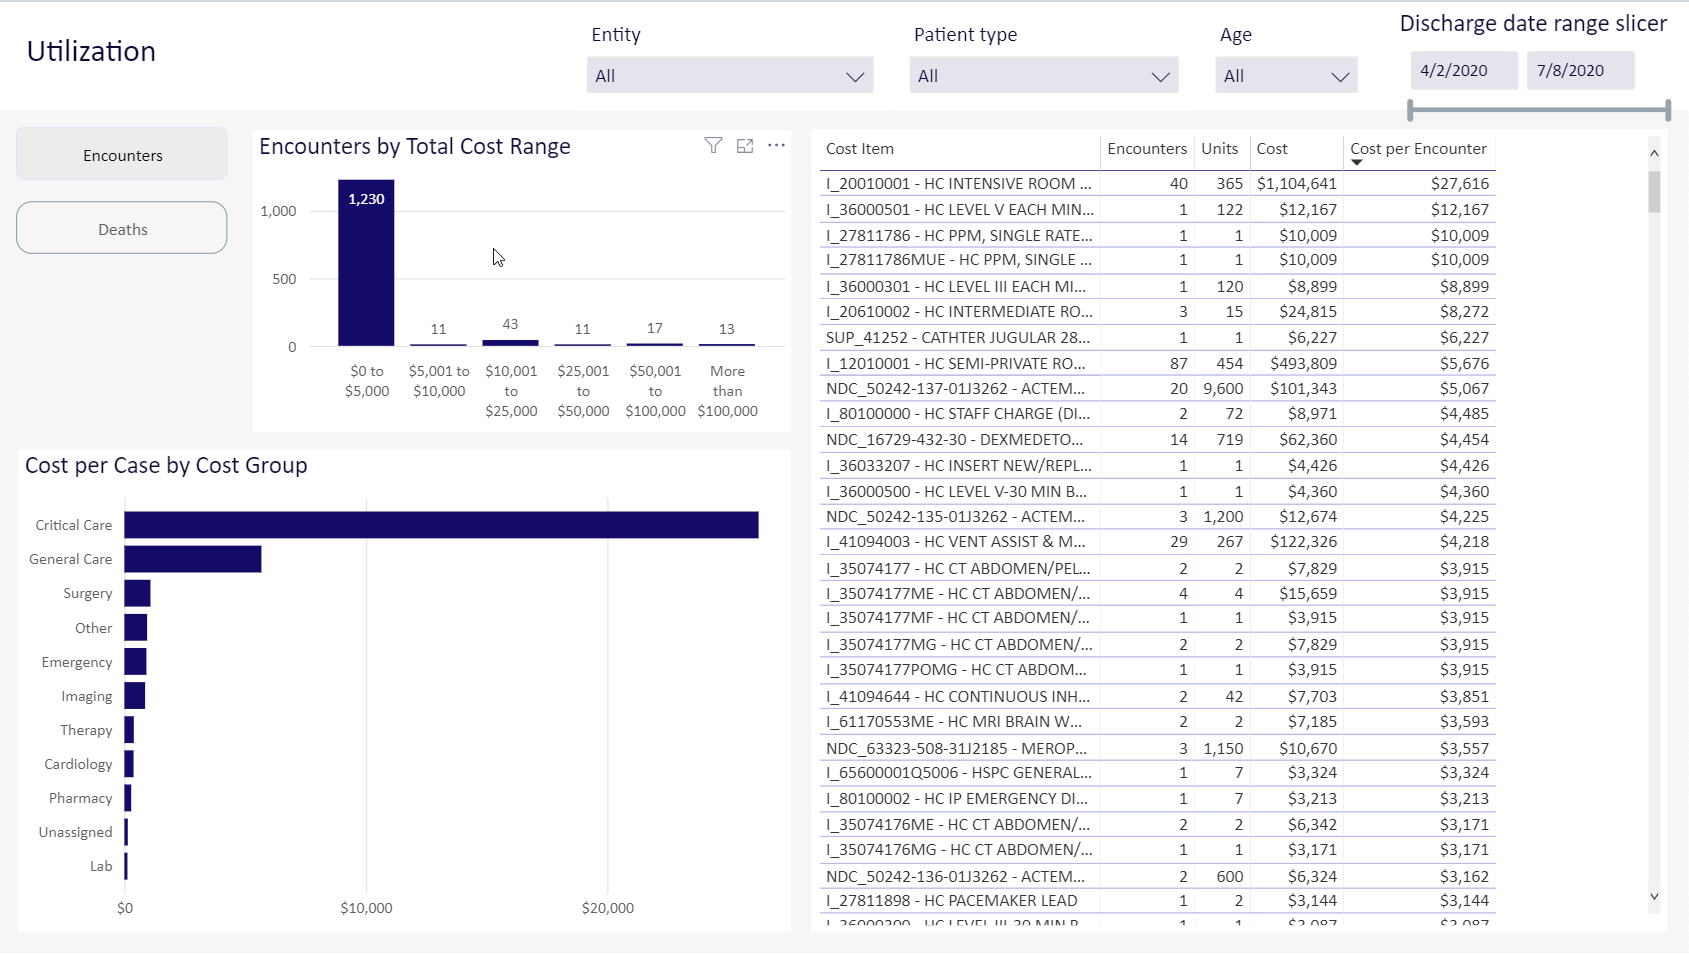
The Utilization report provides a view of the costs of encounters by encounter types, as part of a total cost range, and by cost group.
Click image to view full size
Slicers
This report provides filtering options that let you create a set of data, giving you the option of viewing the precise data you want to view.
Entity
The entity drop-down lists all of the clinics, hospitals, and other entities that comprise your institution. You can choose to view all of those entities or select a single entity to view.
Patient type
The patient drops-down lists the ways a patient was seen, such as inpatient or outpatient emergency. The list will show the patient types used in your organization.
Age
The age drop-down lists these age categories: 0-17, 18-49, 50-64, 65-84, and 85+. You can also select all or blank.
Discharge date range
This control lets you select a range of dates of discharge. You can use the slider or, for more precision, click on each date box to choose a date from a calendar.
TIP: Use the dashboard tools to view, export, and sort the data; view data as table; and more.
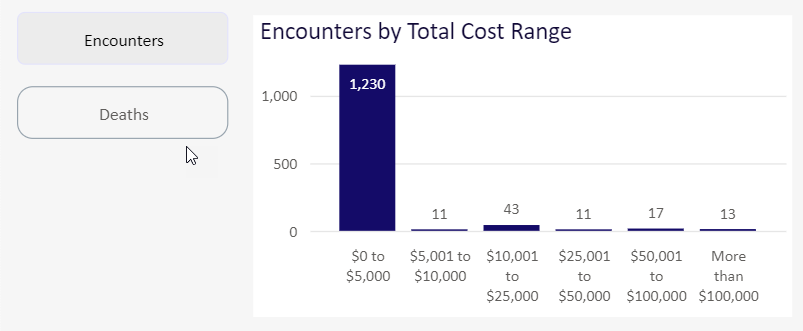
Encounters by Total Cost Range
Click image to view full size
This bar chart shows the count of cases by cost groups. The cost groups are:
-
$0 to $5,000
-
$5,001 to $10,000
-
$10,001 to $25,000
-
$25,001 to $50,000
-
$50,001 to $100,000
-
More than $100,000
The actual count of cases is shown in the column (when space permits).
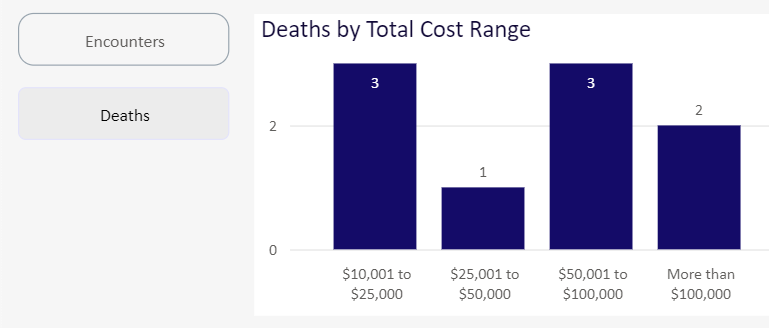
Deaths by Total Cost Range
Click image to view full size
This bar chart shows deaths in the encounter group by cost range. If no deaths occurred in a cost range, that cost range is not included in the chart.
The actual count of cases is shown in the column (when space permits).
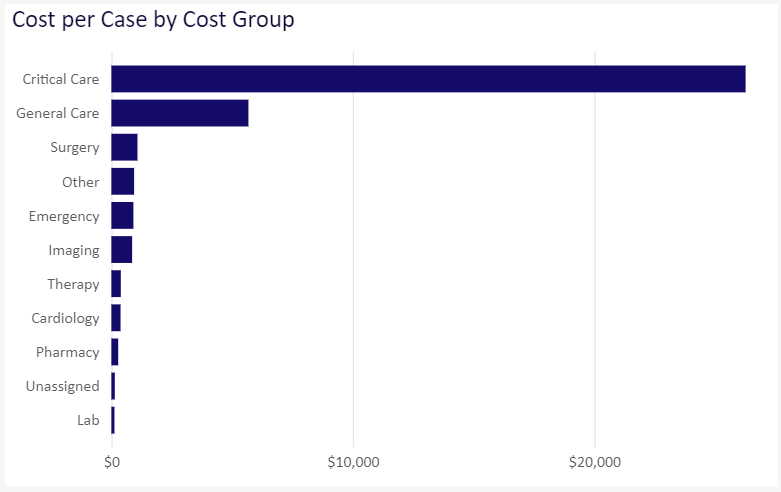
Cost per Case by Cost Group
Click image to view full size
This chart groups cases by the cost group and shows the average of the cost of cases for each cost group.
Encounters table
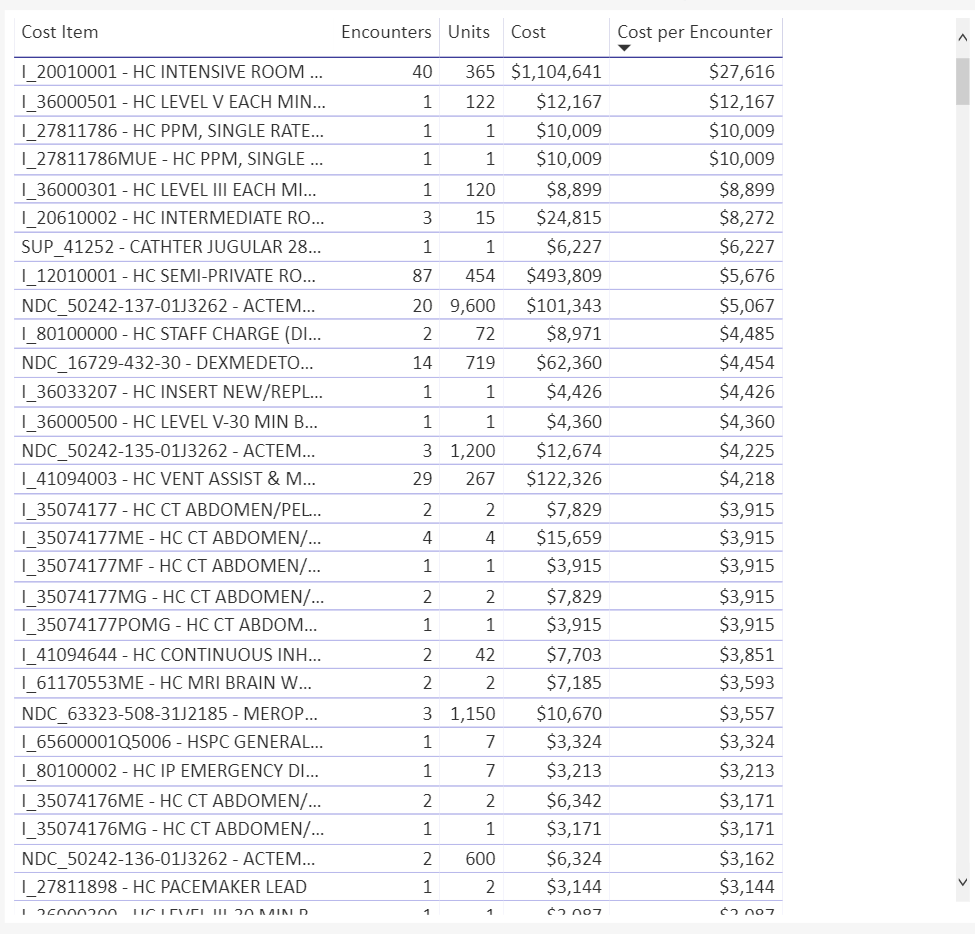
Click image to view full size
This table provides data about encounters and cost items.
| Cost Item | Cost items are for an organization. Cost items can be procedures, labs, physical therapy, medications, and other items |
| Encounters | The number of encounters during the discharge date range for the entities, patient types, and age ranges you specified |
|
Units |
|
| Cost | The total dollar amount for all encounters for a cost item |
| Cost per encounter | The dollar amount per encounter for a cost item |
You can sort this table by any of its columns using the up and down arrows.
Navigation
-
Use the tabs at the bottom of the page to view other related reports in the category
-
Use the Navigation menu in the upper-left corner to return to Recent places that you've visited or to the Intelligence Center.